| Issue |
Security and Safety
Volume 2, 2023
Security and Safety in Unmanned Systems
|
|
|---|---|---|
| Article Number | 2023027 | |
| Number of page(s) | 19 | |
| Section | Intelligent Transportation | |
| DOI | https://doi.org/10.1051/sands/2023027 | |
| Published online | 16 October 2023 | |
Research Article
Systematic assessment of cyber-physical security of lane keeping control system for autonomous vehicles
1
Department of Control Science and Engineering, Tongji University, Shanghai, 200092, China
2
Clean Energy Automotive Engineering Center, Tongji University, Shanghai, 201804, China
3
Dongfeng Technical Center, Dongfeng Motor Corporation, Wuhan, 430056, China
* Corresponding author (email: This email address is being protected from spambots. You need JavaScript enabled to view it.
)
Received:
15
March
2023
Revised:
5
June
2023
Accepted:
17
August
2023
Abstract
In this article, a systematic assessment of cyber-physical security is developed for the lane-keeping control (LKC) system of autonomous vehicles (AVs), which has not been attempted before. A novel impact analysis methodology for typical cyber-attacks is proposed with new evaluation metrics from the viewpoint of safety and performance and innovative index-based resilience and security criteria. Specifically, a security criterion is investigated by tracking performance, comfort and vehicle stability to evaluate the safety and security of the vehicle LKC system. Hardware-in-the-Loop (HiL) experimental results show that the proposed evaluation metrics are effective in analyzing the impact of cyber-attacks on the commercial LKC system of Dongfeng Motor comprehensively. Finally, the conclusion provides guidelines for attack detection, diagnosis, and countermeasures for AVs.
Key words: cyber-physical system / cyber-security / autonomous vehicles / impact analysis / critical metrics
Citation: Wang Y, Huang A and Yang F et al. Systematic assessment of cyber-physical security of lane keeping control system for autonomous vehicles. Security and Safety 2023; 2: 2023027. https://doi.org/10.1051/sands/2023027
© The Author(s) 2023. Published by EDP Sciences and China Science Publishing & Media Ltd.
 This is an Open Access article distributed under the terms of the Creative Commons Attribution License (https://creativecommons.org/licenses/by/4.0), which permits unrestricted use, distribution, and reproduction in any medium, provided the original work is properly cited.
1. Introduction
With the significant advancements in traffic, road, and environmental information enabled by vehicle-to-X (V2X) communications (which can involve infrastructure, cloud, or vehicle-based systems), autonomous vehicle (AV) technology has the potential to significantly enhance driving safety, comfort, and energy efficiency [1]. However, as a large number of AV control systems are integrated into networks, this inevitably brings up cybersecurity concerns [2]. As demonstrated by recent high-profile cyber-attack cases [3–5], AVs are vulnerable to these types of attacks. Such attacks can allow an attacker to circumvent the vehicle control systems, potentially leading to severe consequences such as disabling brakes, turning off headlights, and taking over steering. For instance, [6] designed a malicious attack that aimed to modify the feedback measurements of anti-lock braking systems, potentially causing life-threatening situations. Several spoofing attacks on the global positioning system (GPS) have been proposed by [7] to cause course deviation in AVs. Additionally, some literature [8–10] reports cyber-attacks that utilize local access (such as through the onboard diagnostics (OBD-II) port) or remote access (such as through wireless channels like Bluetooth). Furthermore, cyber-attacks in AVs through vehicle-to-vehicle (V2V) and vehicle-to-infrastructure (V2I) channels were discussed in [11, 12] and have received increased attention in real-life scenarios over the last three years [13, 14, 46].
Due to the connection with environmental perception modules, higher levels of autonomous driving, and greater networking, the cyber-physical security of the advanced driving assistant system (ADAS) in AVs is receiving much more attention. For example, the connectivity between AVs, charging stations, and smart grids may expose AVs to cyber-attacks. Compared to conventional cyber approaches for human-driven vehicles that focus on a vehicle’s entry points [8, 9], cyber-physical security monitoring can serve as a second line of defense because abnormal system measurements serve as clear indicators for potential cyber-attacks. However, cyber-physical security in AVs is still in its infancy. Due to the lack of security monitoring, AVs are prone to a wide range of cyber-attacks, ranging from conventional eavesdropping and denial of service (DoS) attacks to man-in-the-middle attacks that degrade AV performance [16]. The consequences of these attacks would be catastrophic, as they can cause physical damage to vehicles, traffic participants, and infrastructure. While there have been some preliminary works on the cyber-security of lane-keeping control (LKC) systems, much more research is needed to fully address the security concerns of AVs [17–19]. However, to our knowledge, there are currently no existing works on vulnerability assessment, cyber-threat detection, and threat-resilient control of core control units for a commercial LKC system that satisfies the standard of functional safety, such as the International Organization for Standardization (ISO) 26262. This paper presents a systematic vulnerability assessment of various cyber-attacks that may apply to a commercial LKC system through the use of Hardware-in-the-Loop (HiL) experiments conducted at Dongfeng Motor. In the following sections, the literature and challenges of vehicle cybersecurity are reviewed, followed by a description of the methods, results, and contributions of this research.
1.1. Literature review and challenge of vehicle cybersecurity
The growing range of cyber-security risks has highlighted the importance of increasing vehicle cyber-security techniques for both theoretical and industrial aspects. There are two schemes for improving vehicle cyber-security. The first scheme focuses on increasing the ability of an electronic control unit (ECU) to prevent malicious attacks. Throughout the vehicle development cycle, automakers define core performance requirements of subsystems to automotive parts suppliers and design the subsystems while considering their security within the software. To prevent malicious attacks through direct contact with the OBD-II port, automakers keep the communication protocol of the OBD-II secret to the public. In addition, several critical practices such as secure hardware, secure software updates, penetration testing, and code reviews are widely used by the automotive industry to improve cyber-security [20]. Vehicle engineers also consider approaches to information security during driving, such as message authentication and encryption, and the use of firewalls between external networks and vehicle devices [21, 22]. While conventional vehicle cybersecurity and information-security approaches are essential, they alone cannot guarantee the security of the entire system. Therefore, researchers are focusing more on cyber-physical security from the control perspective, risk assessment, and resilient control, which aims to improve the resilience of automotive control systems to attacks. This includes risk assessment, attack detection, and prevention [26], and resilient control as summarized in Table 1.
Research on risk assessment and resilient control for autonomous vehicles (2013–2022)
While these efforts provide some technical foundations, the challenges of cyber-physical security in AVs remain significant. Firstly, most of the existing works are developed for human-driven vehicles rather than AVs. Secondly, only function-level control algorithms are addressed, while commercial specifications and security assessments of a production-level autonomous driving system, such as LKC, receive little attention. It is essential, particularly for AVs, to have a systematic assessment of cyber-physical security that is developed for real-use electronic control units (ECUs) and real cyber-attacks. In [17], a systematic assessment of cyber-physical security in electric vehicles with four motor drives was presented, where the impact of performance degradation of the motor drive on the vehicle’s safety was evaluated, and index-based evaluation metrics in terms of system performance were developed. In [18], a cyber-attack-resilient controller was designed to enhance the cyber-physical security of in-wheel-motor-driven electric vehicles. A model-based observer was proposed to estimate cyber-attacks, and a robust predictive controller was then designed to generate an assistant yaw moment to recover the LKC system. To comprehensively evaluate complicated control systems in AVs, such as safety systems (electronic stability control, antilock brake, etc.), autonomous driving systems (adaptive cruise control, LKC, etc.), and even energy management systems, more detailed models and metrics should be considered. For example, in [19], it was pointed out that increased driver’s neural response delay and muscle action delay during cyber-threats have a significant influence on lateral vehicle stability and recovery time. Therefore, an improved reference generator was proposed to address this issue by considering the driver’s neural response delay and muscle action delay during cyber-threats. These performance metrics should be specifically addressed for LKC systems in AVs, as conventional approaches for function-level control algorithms may not be feasible. In summary, it is essential to address the cyber-security challenges of commercial ECUs in AVs, and novel methodologies for vulnerability assessment should be further developed.
1.2. Works and contributions
In this article, we present a systematic vulnerability assessment of AVs, and our main contributions are as follows:
-
We propose a framework for impact analysis of cyber-physical security on LKC systems in AVs. This framework includes the environment perception module and the vehicle motion control module, which work together to maintain the vehicle in the middle of a lane.
-
For the vulnerability assessment of the LKC system in an AV, we designed a triple-step (TRI) control method for LKC, which is considered one of the applications in lane-keeping assist. Based on the control system, we develop innovative index-based evaluation metrics in terms of tracking performance, passenger comfort, vehicle stability, security, and resilience. These metrics allow us to assess the impact of cyber-attacks on the LKC system, and if an attack does not impact these metrics, it may be negligible.
-
We consider three common types of cyber-attacks in our vulnerability assessment: false data injection (FDI) attacks, denial of service (DoS) attacks, and replay attacks. We contaminate the signals in the Hardware-in-the-Loop (HiL) experiments with nine groups of parameters: the confidence for this line, longitudinal start point of the line, heading angle, curvature of the line, lateral acceleration, yaw rate, longitudinal speed, longitudinal acceleration, and steering angle. We perform a total of 128 HiL experimental cases.
-
We analyze the impact of cyber-attacks under specific and statistical results, and we discuss the vulnerability of the vehicle to each attack type based on the evaluation metrics and security criteria. Our conclusions can serve as guidelines for attack detection and countermeasures.
Overall, our work provides a comprehensive framework and methodology for the systematic vulnerability assessment of AVs, which is essential for ensuring the safety and security of autonomous driving systems.
The paper is organized as follows. In Section 2, we provide an introduction to the system architecture and present the framework for vulnerability impact analysis. Section 3 describes the design of a TRI control-based LKC method and provides the problem formulation. In Section 4, we describe the mathematical modeling of cyber-attacks and their potential impact on the system. Section 5 presents our index-based evaluation metrics, and in Section 6, we present our experimental results and the impact analysis of different cyber-attacks. Finally, we provide our conclusions in Section 7.
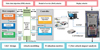 |
Figure 1. System diagram of the Dongfeng Motor Hardware-in-the-Loop simulation platform for AVs |
2. System architecture and framework of impact analysis on vulnerability
As illustrated in Figure 1, the Dongfeng Motor HiL simulation platform for AVs is comprised of a system-level ECU, which is divided into three parts: the host computer, NI real-time module, and ECU. The host computer is responsible for running a high-fidelity vehicle under real road scenarios, using a vehicle model built by CarMaker and Simulink, and a sensor model simulated by CarMaker to obtain virtual lane and target information. This information is then sent to the HIL simulation platform via TCP/IP. The management software, NI pxie-8840, and VeriStand 2015 are utilized to support integrated testing of software and hardware for ECUs, including communication, functional logic, and fault injection. The tested ECU also incorporates algorithms for sensing fusion, decision-making, and control. All signals between the NI real-time module and ECU are transmitted by high-speed Control Area Network (CAN) buses.
The Lane-Keeping Control (LKC) system is an advanced driver-assistance system that helps keep a road vehicle centered in the lane, freeing the driver from the task of steering. When combined with Adaptive Cruise Control (ACC), this feature can allow for unassisted driving for a certain period of time. However, since cyber-attacks can significantly impact vehicle safety with dynamic features, attacks on the LKC can result in abnormal driving conditions that the driver may not easily notice. For example, Guo et al. [17] discussed several stealthy attacks that aimed to degrade the steering motor’s capabilities.
Therefore, it is essential to assess the cyber-physical security of LKC. The inputs to an LKC are related to vehicle dynamics, traffic, and road information from perception sensors, Vehicle-to-Everything (V2X), and local information from onboard sensors. When these signals are attacked, the vehicle can suffer from high lateral offset, transient dynamics, and vehicle instability. To assess the impact of cyber-attacks on the LKC, it is necessary to observe several performance metrics, such as lateral tracking error, vehicle acceleration, and vehicle yaw rate under different drive cycles.
In the following sections, we present a case study of a nonlinear LKC method for AVs, and then systematically analyze the impact of various cyber-attacks on the LKC.
3. Vehicle modeling and LKC design
3.1. Vehicle modeling
The lane-keeping problem of a vehicle under investigation is modeled by the Serret-Frenet equations, which consider the inertial frame {E}, the lane frame {SF}, the vehicle frame {V}, and the preview point frame {PV}. Let the center of the vehicle be ηE, V
E = [x, y]T and the heading angle φ be the yaw angle between {V} and {E}. Then, the heading angle of the vehicle in {SF} is defined as φe = φ − φSF. Further, we consider {PV} as a coordinate information of {V} to the preview point and the look-ahead distance DL as the distance from {V} to {PV} such that the preview point in {SF} is located at ![Mathematical equation: $ \eta^{SF}_{SF,B}=[0,y_e]^T $](/articles/sands/full_html/2023/01/sands20230005/sands20230005-eq1.gif) . Then, the lateral motion of the vehicle is expressed as
. Then, the lateral motion of the vehicle is expressed as
 (1)
(1)
 (2)
(2)
![Mathematical equation: $$ \begin{aligned} R_2(\varphi _e)&= \left[\begin{array}{cccc} \cos \varphi _e - \sin \varphi _e \sin \varphi _e \cos \varphi _e \end{array}\right] \end{aligned} $$](/articles/sands/full_html/2023/01/sands20230005/sands20230005-eq4.gif) (3)
(3)
![Mathematical equation: $$ \begin{aligned} \omega ^{SF}_{E,SF} \times \eta ^{SF}_{SF,PV}&= \left[\begin{array}{cccc} 0&-\dot{\varphi }_{SF} \\ \dot{\varphi }_{SF}&0 \end{array}\right] \left[\begin{array}{cccc} 0 \\ y_e \end{array}\right] \end{aligned} $$](/articles/sands/full_html/2023/01/sands20230005/sands20230005-eq5.gif) (4)
(4)
![Mathematical equation: $$ \begin{aligned} \omega ^{V}_{E,V} \times \eta ^V_{V, PV}&= \left[\begin{array}{cccc} 0&-\Omega _z \\ \Omega _z&0 \end{array}\right] \left[\begin{array}{cccc} D_L \\ 0 \end{array}\right] \end{aligned} $$](/articles/sands/full_html/2023/01/sands20230005/sands20230005-eq6.gif) (5)
(5)
where  is a vector of the preview point speed in {PV},
 ![Mathematical equation: $ v^{SF}_{E,SF}=[\dot{s},0]^T $](/articles/sands/full_html/2023/01/sands20230005/sands20230005-eq8.gif) is the arc-length of the desired lane,
is the arc-length of the desired lane,  is the yaw rate of the AV,
 ![Mathematical equation: $ v^{SF}_{SF,PV}=[0,\dot{y}_e]^T $](/articles/sands/full_html/2023/01/sands20230005/sands20230005-eq10.gif) ,
, ![Mathematical equation: $ v^{V}_{E,V}=[V_x,V_y]^T $](/articles/sands/full_html/2023/01/sands20230005/sands20230005-eq11.gif) , vV, PV
V = [0, 0]T, ηV, PV
V = [DL, 0]T and Vx and Vy are the longitudinal and lateral speeds of the vehicle, respectively.
, vV, PV
V = [0, 0]T, ηV, PV
V = [DL, 0]T and Vx and Vy are the longitudinal and lateral speeds of the vehicle, respectively.
By substituting (1) into (2) and eliminating the intermediate variable s, the control-oriented lateral motion model can be described as follows:
 (6)
(6)
 (7)
(7)
where model uncertainties d1 = Vx(sinφe − φe)+DL
Ωz(cosφe − 1)+Vycosφe and ![Mathematical equation: $ d_2=\frac{K_L}{1-y_e K_L}[(V_x+D_L \Omega_z)\sin\varphi_e - V_x \cos \varphi_e] + K_L V_x $](/articles/sands/full_html/2023/01/sands20230005/sands20230005-eq14.gif) can be attenuated by the following control design.
can be attenuated by the following control design.
3.2. LKC design
As one of the promising LKC strategies, TRI-based approaches have been extensively studied theoretically [29]. In this subsection, we develop a TRI-based LKC for vulnerability assessment of the vehicle.
First, the information of lanes can be determined based on camera sensors and thus the lateral offset ye in (6) can be calculated by a second-order polynomial function with the look-ahead distance DL, i.e.,
 (8)
(8)
where ci = ωi, L ci, L + ωi, R ci, R with i = 0, 1, 2 are the lane coefficients measured by the mean of the left and right lanes. From the geometrical relationship and the assumption of a slowly changing longitudinal speed, the heading error φe and the curvature KL of the vehicle are calculated by
 (9)
(9)
 (10)
(10)
where the lateral speed Vy is assumed to be small such that φe is small enough. In addition, the yaw rate Ωz and the longitudinal speed Vx can be obtained from onboard sensors such as the electronic stability program (ESP).
Based on Ackerman steering, the front steering angle u is given by  , where L is the distance from the front axle to the rear axle and R0 is the ideal turning radius that satisfies Vx = Ωz
R0. However, when the tire slip angle is not negligible under high-speed or highway driving, the real turning radius of the steering angle should be modified as
, where L is the distance from the front axle to the rear axle and R0 is the ideal turning radius that satisfies Vx = Ωz
R0. However, when the tire slip angle is not negligible under high-speed or highway driving, the real turning radius of the steering angle should be modified as  where EG is a coefficient that is calibrated from experiments. Then, the yaw motion of the vehicle is approximated using the modified radius as follows:
 (11)
(11)
Built on the above modeling and discussions, the TRI-based control law is designed as
 (12)
(12)
 (13)
(13)
 (14)
(14)
where KP and TI are the PI control gains. The stability of the closed-loop system can be proved by the Lyapunov theorem.
As the main focus of this work is on vulnerability assessment rather than control design, the LKC method proposed in this paper only involves the basic control algorithm. This is because introducing more control functions, such as those related to functional safety and intended functional safety, is limited by both space constraints and confidentiality agreements. Instead, this paper aims to systematically analyze the impact of cyber-attacks on the overall performance of an LKC. To measure this impact, we propose a set of innovative performance metrics, which include tracking performance, comfort, stability, safety, and resilience.
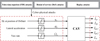 |
Figure 2. Diagram of inputs, cyber-attacks, and evaluation metrics |
4. Attack modeling
The LKC system in Figure 2 displays the most influential signals that may be subject to malicious attacks, which include the lateral offset at the look-ahead point ye, the yaw rate Ωz, and the lateral acceleration ay obtained through onboard sensors. To perform a physics-based impact analysis of the cyber-attacks on these signals, it is essential to establish the mathematical modeling of the cyber-attacks. So far, most published literature categorizes these attacks into three groups: denial of service (DoS) attacks, replay attacks, and false data injection (FDI) attacks. DoS attacks generally attempt to make the system resources unavailable, resulting in the corresponding signal being considered as a constant value. Assuming that the time horizon under attack is denoted as [tatk, tatk + Tatk], where tatk is the starting time instant of the attack and Tatk is the duration time of the attack, then the feedback signal used by the controller is:
![Mathematical equation: $$ \begin{aligned} \bar{y}_e = \left\{ \begin{array}{llll} {y}_e(t_{atk})&\text{ if}~t \in [t_{atk},t_{atk}+T_{atk}] \\ y_e(t)&\text{ else}. \end{array}\right. \end{aligned} $$](/articles/sands/full_html/2023/01/sands20230005/sands20230005-eq24.gif) (15)
(15)
For replay attacks, the measurements are either repeated or delayed, leading to  , where 𝕐 is the set of past information. In the case of false data injection (FDI) attacks, we define two common expressions as:
 (16)
(16)
where δatk ∈ Δatk and γatk ∈ Γatk denote the unknown signals due to the malicious modification of the signals. Normally the extra terms are bounded by compact sets Δatk and Γatk, which are determined by the physical limits. Notice that δatk can be white noise (δatk, 1), periodic attenuating signal (δatk, 2), periodic impulse injection δatk, 3, and constant value δatk, 4 ≡ 𝒞, wherein, δatk, 2 and δatk, 3 are expressed as
 (17)
(17)
 (18)
(18)
where A, τ0, and f represent the oscillation amplitude, decaying coefficient, and oscillation frequency, respectively; kδ is an integer; and D, Ts, K are the duty cycle, signal period, and attack amplitude, respectively.
Attack modeling and case definition
Using the attack modeling discussed above, we created a visual representation of how these attacks impact the vehicle system, which is illustrated in Figure 2. In order to comprehensively assess the vulnerability of the designed LKC and the overall performance of the vehicle, we conducted multiple simulations targeting different attacks. The specific expressions for the attacks are provided in Table 2. For δatk, 2, we set f = 1, τ0 = 10, A = 1.5 for ay, A = 1 for ye, and A = 3 for Ωz. For δatk, 3, we set D = 0.3, Ts = 1s, K = 0.25 for ay, K = 1 for ye, and K = 0.5 for Ωz. For δatk, 4, we set 𝒞 = 1 for ay, 𝒞 = 0.5 for ye, and 𝒞 = 1 for Ωz. It’s worth noting that all time horizons under attack (marked as Tatk = 1s) are the same for comparison between cases. The level of signal modification has a significant influence on the results, despite the same type of cyber-attack. Therefore, to ensure a fair comparison between attack types and cases, we maintained the same intensity of attacks.
The basic attack models currently under consideration are not sufficient to address the complexity and sophistication of attacks on control systems. Note that attackers are constantly evolving their tactics to overcome existing defenses, so the development of more advanced attack models is a constant and ongoing process, such as covert attacks [32], zero dynamic attacks [32] and amplifying attacks [33].
5. Evaluation metrics
5.1. Evaluation metrics for system performance
To evaluate the performance of a system, it is essential to consider multiple evaluation metrics simultaneously. This is because improving one performance measure may lead to the degradation of another. For instance, when evaluating the performance of lane tracking and passenger comfort, it’s important to develop evaluation metrics from the perspectives of both steady-state and transient performance.
This approach enables us to investigate whether trade-offs between multiple types of performance exist and to identify the performance limits of lane-keeping systems. In order to calculate all quantitative metrics, we use previous measurements, states, and control inputs within a fixed sliding window of time, which is defined as [t0 − Tobv, t0]. Here, t0 represents the current time.
Tracking performance. As described above, the primary objective of the lane-keeping system is to follow the target lane without the need for driver intervention. Therefore, the key indicators that determine the system’s performance are the lane tracking error and ripple. These indicators can be defined using the root mean square (RMS) lateral offset at the look-ahead point, denoted as ℐer, and the integral value ℐrp over the sliding window.
The expression of this metric is as follows:
![Mathematical equation: $$ \begin{aligned}&\mathcal{I} _{er} = \sqrt{\frac{1}{T _{obv}}\int _{t_0-T _{obv}}^{t_0}{\left[ y_e\left( t \right) -y_{e,ref}\left( t \right) \right] ^2\mathrm{d}t}} \end{aligned} $$](/articles/sands/full_html/2023/01/sands20230005/sands20230005-eq36.gif) (19)
(19)
 (20)
(20)
The use of these metrics has a significant advantage as it enables us to evaluate the integrated value of the lateral offset. Additionally, it reflects the fundamental dynamic performance, and large values can directly impair the system’s function, leading to severe consequences, particularly in urban scenarios.
Passenger comfort. It’s evident that lane-keeping systems with poor passenger comfort are not suitable for real-world vehicle applications, even if they exhibit high tracking performance. Generally, the smoothness of the vehicle’s acceleration is one of the primary factors that affect passenger comfort, and a non-smooth profile can make passengers feel uncomfortable. In this study, we assume that longitudinal and vertical accelerations are zero, and only lateral acceleration is considered.
To evaluate passenger comfort, two metrics are designed: the RMS lateral acceleration and the lateral acceleration ripple. These metrics are used to quantify the smoothness of the vehicle’s lateral acceleration. The expressions for these metrics are given below:
![Mathematical equation: $$ \begin{aligned} \mathcal{I} _{pc1}&=a_{rms}=\sqrt{\frac{1}{T_{obv}}\int _{t_0-T_{obv}}^{t_0}{\left[ a_y \left( t \right) \right] ^2\mathrm{d}t}} \\ \mathcal{I} _{pc2}&=\int _{t_0-T_{obv}}^{t_0}{\left| a_y \left( t \right) \right|\mathrm{d}t} \end{aligned} $$](/articles/sands/full_html/2023/01/sands20230005/sands20230005-eq38.gif) (21)
(21)
Vehicle stability. Vehicle stability refers to the vehicle’s ability to regain its original driving state and direction as quickly as possible after encountering external interference while driving without losing control, sideslip, or rolling over. In this study, we use the yaw rate to measure vehicle stability, as a high yaw rate can cause the vehicle to lose control.
To evaluate vehicle stability, we have designed one metric, which is the maximum deviation. The expression for this metric is given below:
![Mathematical equation: $$ \begin{aligned} \mathcal{I} _{vs}=\underset{t\in \left[ t_0-T _{obv},t_0 \right]}{\max }\left| \Omega _z \left( t \right) \right| \end{aligned} $$](/articles/sands/full_html/2023/01/sands20230005/sands20230005-eq39.gif) (22)
(22)
The concept of a vehicle stability metric is a measure of a vehicle’s ability to maintain stability under different driving conditions [34]. This is an important consideration in vehicle design, as stability is essential for safe and efficient operation. Using a stability margin indicator as an evaluator of stability may be developed in future.
5.2. Evaluation metrics for system security and resilience
Next, we consider the security and resilience of the system and propose innovative index-based criteria.
Security of the system. Unlike the theoretical concepts of stability and robustness against uncertainties or disturbances, security refers to whether the damage caused by malicious behaviors or attacks is acceptable in terms of system performance and requirements. To define the boundaries of security, we have proposed index-based criteria, which are as follows: Based on the defined evaluation metrics ℐκ (κ = {er, rp, pc1, pc2, vs}), if a boundary Bκ could be found, which has the following properties: 1) the boundary Bκ is finite; 2) if ℐκ ∈ Bκ, the damage caused by the attacks are acceptable. Then, the system is secure.
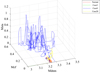 |
Figure 3. Index-based phase portrait |
It is important to note that the boundary is generally defined based on physical significance and is a heuristic conclusion drawn from extensive simulations and experiments. To derive this boundary, we reformulate the metrics from three aspects: dynamic performance, comfort, and stability, as ℳdnm = p1ℐer + p2ℐrp ≥ 0, ℳcf = p3ℐpc1 + p4ℐpc2 ≥ 0, and ℳsta = p5ℐvs. Here, pj ≥ 0 (j = 1, 2, 3, 4, 5) is the weighting factor to match different physical meanings and units. We can then obtain a 3-D (ℳdnm − ℳcf − ℳsta) phase portrait of the system over the sliding window [t0 − Tobv, t0], in which the boundary is defined as a tetrahedron ℬ1 or a part of a spheroid ℬ2 limited by ℳdnm, max, ℳcf, max, and ℳsta, max. The security can then be defined qualitatively as follows: Suppose a boundary  determined by ℳdnm, max, ℳcf, max, and ℳsta, max is given. If the operating point belongs to
  , then the system is considered secure, and inversely, if it lies outside the boundary, it is considered insecure. As shown in Figure 3, under normal conditions, the region of operating points is close to the origin. As the scale of the attack increases, the operating points gradually spread out until they exceed the defined boundary. Therefore, the index can reflect the security of the system and can also be one of the criteria for detecting cyber threats.
To enable quantitative analysis of system security, we define a metric that reflects the security level of the system under different cyber-physical threats and attack targets, based on the previously defined boundary  as follows:
Assume the security boundary is defined as a tetrahedron in the three dimensional coordinate system (ℳdnm − ℳcf − ℳsta), whose vertexes are (ℳdnm, max, 0, 0), (0, ℳcf, max, 0), (0, 0, ℳsta, max), and the coordinate origin (0, 0, 0). At the current time t0, the operating point in the three dimensional coordinate system is (ℳdnm(t0),ℳcf(t0),ℳsta(t0)). Then, the metric that quantitatively reflects the system security can be defined as
 (23)
(23)
which represents the security factor of the system.
According to the aforementioned definition, a higher value of ℐse indicates a greater level of damage to the system caused by cyber-physical threats or attacks.
Resilience of the system. The resilience of a system refers to its ability to recover from malicious attacks. Therefore, based on the above definition of security, we can define another boundary in the 3-D phase portrait as follows: If a boundary Bres could be found, which has the following properties: 1) the boundary Bres is finite; 2) if the operating point {ℳdnm, ℳcf, ℳsta} belongs to Bres, the system can restore to its reasonable condition when the attack is withdrawn. Then, the system is resilient.
When considering real-life applications, the ability to recover from malicious attacks is important, but so is the recovery time, which reflects the transient performance of the system. Therefore, we define the recovery time Tres, σ, where σ = ℳdnm, ℳcfb, ℳeng, to indicate how quickly the σ-th metric returns to its normal condition after the attack is removed. Then, the index reflecting the resilience of the system is defined as the average of these three recovery times, given by:
 (24)
(24)
6. Experiments and cyber-attack impact analysis
In this section, we aim to evaluate the vulnerabilities of AVs equipped with the designed LKC to cyber-attacks. To this end, we build the AV in the HiL simulation platform, as illustrated in Figure 4, and define the attacks as shown in Table 2. All 25 measurements and attacked signals are shown in Table 3. The experimental setup includes an AC power management, a battery simulation, a power switchboard and fault injection, an ECU, a CAN, a multi-I/O board, a host computer, and a NI real-time module, which can ensure that the results obtained are accurate and reliable, and can be used to inform the development of effective security measures
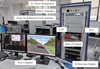 |
Figure 4. Dongfeng HiL real-time simulation testbed |
Measurement and Attacked Signals in Perception and Chassis Systems
Our assessment comprises three main works: First, we evaluate the TRI-based LKC as the basis for vulnerability assessment by observing its dynamic performance without any cyber-attacks. This evaluation includes assessing the LKC’s stability, lane tracking ability, and passenger comfort. Second, based on the defined evaluation metrics, we propose innovative index-based resilience and security criteria that can be utilized for cyber-attack detection. Third, we analyze the impact of cyber-attacks on the AV under specific and statistical results, which can provide valuable insights for attack detection and countermeasures.
The implementation of fault injection testing is achieved by interrupting the data interface between the simulation environment and the real-time machine. It involves intercepting and replacing the real signals that need to be simulated with faulty data. This simulation causes a scenario where a certain node on the bus sends a faulty signal due to an attack while the real-time machine acts as a gateway, transmitting the real bus signals (specifically, some signals on the chassis CAN and the front radar and camera private CAN) to the controller. Throughout this process, the controller, CAN board, physical CAN lines, and channels are consistent with those of the actual vehicle. The output module of the real-time machine simulates the role of the vehicle gateway, and it can be assumed that the simulation test environment is consistent with the actual vehicle within the scope of fault injection.
6.1. Observation of specific cases
For a more detailed discussion and observation, the results of Cases 1, 7, and 22 are presented in Figure 5, Cases 2, 8, and 23 are given in Figure 6, and Cases 3, 9, and 24 are given in Figure 7. From these results, it is evident that FDI attacks can severely damage the system, and all of the metrics can reflect the impact. Although the system can recover after the attacks are withdrawn, the recovery time is also considerably long when considering real-life damage to physical devices. On the one hand, by comparing the results with the same attack, it is clear that the lateral offset ye is more crucial than the others, for both tracking performance and vehicle stability. Therefore, when designing an LKC, it is essential to pay close attention to ensuring an accurate lateral offset signal. The impact of attacks on lateral acceleration mainly focuses on passenger comfort, as lateral acceleration is the most important metric to evaluate passenger comfort. On the other hand, through comparisons between different attacks on the same signal, it can be seen that the system dynamics vary with attack types.
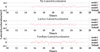 |
Figure 5. Lateral acceleration when different signals are under attack |
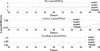 |
Figure 6. Lateral offset when different signals are under attack |
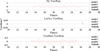 |
Figure 7. Yaw rate when different signals are under attack |
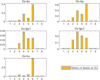 |
Figure 10. Statistical graph of attacks on Ωz in Table 2 |
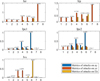 |
Figure 11. Statistical graph of attacks on different signals |
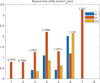 |
Figure 12. Recovery time of different attacks |
6.2. Statistical results and impact analysis
Based on the extensive results, statistical graphs are presented in Figures 8–11. Assuming that the time horizon under attacks is [tatk, tatk + 𝒯atk]=[15, 25]s and the system can recover to its normal conditions within two seconds, as demonstrated in Figures 5–7, we set the time horizon [t0 − 𝒯obv, t0] as t0 = 27s, 𝒯obv = 12s to cover the entire time horizon of attack and system recovery. It is important to note that if the chosen time horizon is wider, such as t0 = 30s and 𝒯obv = 15s, then the proportion of normal conditions is larger, which may weaken the impact of cyber-attacks for integrated metrics due to the larger base value, such as ℐrp, ℐer and ℐvs. Finally, the metrics ℐer, rp, pc1, pc2, vs(t0) are used as the indexes to reflect the overall performance.
After comparing the results of these metrics, we can conclude that they adequately reflect the performance variation due to cyber-attacks, and can be used to develop a cyber-threat detector. Figure 8 displays the statistical results of attacks on lateral acceleration, showing that the impact on Ier, Irp, and Ivs is small, while the impact on Ipc1 and Ipc2 is more significant, indicating that attacks on lateral acceleration have a greater impact on passenger comfort and a minor impact on stability and tracking performance. In Figure 9, all five metrics are affected by attacks on lateral offset signal, indicating that attacking lateral offset will heavily impact the tracking performance, comfort of occupants, and vehicle stability. This is because the lateral offset (ye) is the feedback signal of the control system, which is crucial for the overall performance of the LKC system. In Figure 10, all five metrics have been affected, but the attack types that have a considerable impact are mainly Types 3–6, indicating that the yaw rate is more sensitive to this type of FDI attack, but has stronger resistance to other types of attacks.
Figure 11 presents a comparison of the impacts of different attacks on different signals, providing us with several important insights. Firstly, attacking lateral acceleration has minimal impact on tracking performance metrics, while other attacks on lateral offset and yaw rate have a more pronounced effect on the system’s tracking performance, except for the replay attack (Type 8). Secondly, among all attacks, DoS attack (Type 7) on the lateral offset has the most substantial impact on the tracking performance, as it prevents the control system from receiving the genuine feedback signal, significantly reducing the control performance. It is noteworthy that DoS Attack (7) and Replay Attack (8) have negligible impact on passenger comfort, regardless of the attack signal. Thirdly, among the remaining attacks, attacking lateral acceleration has a significantly greater impact on passenger comfort than attacking the other two signals. Fourthly, attacking lateral acceleration hardly affects vehicle stability, whereas attacking lateral offset and yaw rate may have an impact on vehicle stability, but the types of attacks are different. Specifically, adding white noise or attenuating sine wave signals to lateral offset has a significant impact on the vehicle’s stability, while adding a constant value has little effect on it, which is opposite to the attacks on the yaw rate.
Based on the recovery time shown in Figure 12, we can observe that once the cyber-attack is withdrawn, the LKC system can recover to its normal condition within three seconds. However, Types 4 and 7 attacks may result in longer recovery times, which corresponds to the results of other metrics. Additionally, it is important to note that although the impact of Ωz and ay may appear to be lower than that of ye in the reported graphs, it does not imply that these cyber-attacks have little influence on the LKC system. These attacks were designed under the same intensity, and once the attack intensity is increased, the impact of these attacks would become more noticeable.
7. Conclusion
This paper presents a comprehensive approach to vulnerability assessment of LKC systems for AVs, which can be used to analyze the impact of cyber-attacks on different signals. The proposed approach includes a case study of a TRI-based LKC for AVs and the establishment of innovative index-based evaluation metrics for critical performance evaluation. The results of the vulnerability assessment show that an attacker can significantly degrade the overall performance of the vehicle through FDI attacks, and the proposed metrics can effectively reflect the impact of various cyber-attacks.
In practical applications, these metrics can be used to develop data-based or model-based detection and diagnosis approaches to enhance the security and resilience of LKC systems for AVs. In future work, further investigation can be conducted on the impact of different types of cyber-attacks and the development of more advanced detection and diagnosis methods. Additionally, the proposed approach can be extended to other types of control systems in AVs for comprehensive cyber-security assessments.
In addition to providing a comprehensive analysis of the impact of cyber threats on LKC systems, this paper presents a general framework for vulnerability assessment of control systems in the ECU from a control perspective. For other systems, such as safety systems and energy management systems, a similar approach can be used to conduct a detailed impact analysis using the potential signal inputs and objectives outlined in Section II, under a variety of cyber-physical attacks specific to each system. However, for learning-based systems, such as deep learning approaches for pedestrian detection in rough weather, vulnerability assessment can be more challenging due to their unique algorithm structure compared to traditional control methodologies. Further research is needed to develop appropriate cyber-physical attacks, evaluation metrics, and security frameworks [35] and more in-depth assessment analysis on real vehicles.
Conflict of Interest
The author declares no conflict of interest.
Data Availability
No data are associated with this article.
Authors’ Contributions
Yulei Wang wrote and constructed this paper. An Huang mainly constructed the vehicle model and designed the assessment algorithm. Fan Yang, Jiazhi Zhang and Ning Bian mainly implemented the assessment algorithm and jointly conducted the experiments. Lulu Guo guided the overall work, corrected typos, and jointly wrote this paper.
Acknowledgments
We thank the anonymous reviewers for their helpful comments.
Funding
This work was supported in part by the National Natural Science Foundation of China under Grants No. U1964201, 62373281 and 62333015 and part by Shanghai Municipal Science and Technology Commission No. 23ZR1467700.
References
- Naufal JK, Camargo JB and Vismari LF et al. A2CPS: A vehicle-centric safety conceptual framework for autonomous transport systems. IEEE Trans Intell Transp Syst 2017; 19: 1925–39. [Google Scholar]
- Colabianchi S, Costantino F and Di Gravio G et al. Discussing resilience in the context of cyber physical systems. Comput Ind Eng 2021; 160: 107534. [CrossRef] [Google Scholar]
- Pajic M, Weimer J and Bezzo N et al. Design and implementation of attack-resilient cyberphysical systems: With a focus on attack-resilient state estimators. IEEE Trans Contr Syst Mag 2017; 37: 66–81. [CrossRef] [Google Scholar]
- Ye J, Guo LL and Yang B et al. Cyber-physical security of powertrain systems in modern electric vehicles: Vulnerabilities, challenges, and future visions. IEEE J Emerg Sel Top Power Electron 2021; 9: 4639–57. [CrossRef] [Google Scholar]
- Kim K, Kim JS and Jeong S et al. Cybersecurity for autonomous vehicles: Review of attacks and defense. Comput Secur 2021; 103: 102150. [CrossRef] [Google Scholar]
- Shoukry Y, Martin P and Tabuada P et al. Non-invasive spoofing attacks for anti-lock braking systems. In: International Conference on Cryptographic Hardware and Embedded Systems (CHES 2013), 2013, 55–72. [Google Scholar]
- Tippenhauer NO, Pöopper C and Rasmussen KB et al. On the requirements for successful GPS spoofing attacks. In: Proceedings of the 18th ACM Conference on Computer and Communications Security, 2011, 75–86. [Google Scholar]
- Koscher K, Czeskis A and Roesner F et al. Experimental security analysis of a modern automobile. In: 2010 IEEE Symposium on Security and Privacy. IEEE, 2010, 447–62. [CrossRef] [Google Scholar]
- Checkoway S, McCoy D and Kantor B et al. Comprehensive experimental analyses of automotive attack surfaces. In: USENIX Security Symposium 2011, 2021 447–62. [Google Scholar]
- Zhang T, Antunes H and Aggarwal S. Defending connected vehicles against malware: Challenges and a solution framework. IEEE Internet Things J 2014; 1 : 0–21. [Google Scholar]
- Taeihagh A and Lim HSM. Governing autonomous vehicles: emerging responses for safety, liability, privacy, cybersecurity, and industry risks. Transp Rev 2019; 39: 103–28. [CrossRef] [Google Scholar]
- Schmittner C, Dobaj J and Macher GA et al. A preliminary view on automotive cyber security management systems. In: 2020 Design, Automation & Test in Europe Conference & Exhibition (DATE), 2020, 1634–39. [Google Scholar]
- Wang Y, Wang Y and Qin H et al. A systematic risk assessment framework of automotive cybersecurity. Automot Innovation 2021; 4: 253–61. [CrossRef] [Google Scholar]
- Gao C, Wang G, Shi W et al. Autonomous driving security: State of the art and challenges. IEEE Internet Things J 2021; 9: 7572–95. [Google Scholar]
- GKhan SK, Shiwakoti N and Stasinopoulos P. A conceptual system dynamics model for cybersecurity assessment of connected and autonomous vehicles. Accid Anal Prev 2022; 165: 106515. [CrossRef] [PubMed] [Google Scholar]
- Sun X, Yu FR and Zhang P. A survey on cyber-security of connected and autonomous vehicles (CAVs). IEEE Trans Intell Transp. Syst 2021; 23: 6240–59. [Google Scholar]
- Guo L and Ye J. Cyber-physical security of electric vehicles with four motor drives. IEEE Trans Power Electron 2020; 36: 4463–77. [Google Scholar]
- Guo L, Yang B and Ye J et al. Attack-resilient lateral stability control for autonomous in-wheel-motor-driven electric vehicles. In: 2021 IEEE Transportation Electrification Conference & Expo (ITEC). IEEE, 2021, 200–5. [CrossRef] [Google Scholar]
- Guo L, Yang B and Ye J et al. Attack-resilient lateral stability control for four-wheel-driven EVs considering changed driver behavior under cyber threats. IEEE Trans Transp Electrif 2022; 8: 1362–75. [CrossRef] [Google Scholar]
- Wise D. Vehicle cybersecurity: DOT and industry have efforts under way but DOT needs to define its role in responding to a real-world attack, Gao Reports, 2016. https: //www.gao.gov/products/gao-16-350. [Google Scholar]
- Nanda A, Puthal D and Rodrigues JJPC et al. Internet of autonomous vehicles communications security: overview, issues, and directions. IEEE Wireless Commun 2019; 26: 60–5. [CrossRef] [Google Scholar]
- Chattopadhyay A, Lam KY and Tavva Y. Autonomous vehicle: Security by design. IEEE Trans Intell Transp Syst 2020; 22: 7015–29. [Google Scholar]
- Alipour-Fanid A, Dabaghchian M and Zeng K. Impact of jamming attacks on vehicular cooperative adaptive cruise control systems. IEEE Trans Veh Technol 2020; 69: 12679–93. [CrossRef] [Google Scholar]
- Guo L, Yang B and Ye J et al., Systematic assessment of cyber-physical security of energy management system for connected and automated electric vehicles. IEEE Trans Ind Inf 2020; 37: 3335–47. [Google Scholar]
- Mousavinejad E, Yang F and Han QL et al. Distributed cyber attacks detection and recovery mechanism for vehicle platooning. IEEE Trans Intell Transp Syst 2019; 21: 3821–34. [Google Scholar]
- Limbasiya T, Teng KZ and Chattopadhyay S et al. A systematic survey of attack detection and prevention in Connected and Autonomous Vehicles. Veh Commun 2022; 100515. [Google Scholar]
- Dasgupta S, Rahman M and Islam M et al. A sensor fusion-based GNSS spoofing attack detection framework for autonomous vehicles. IEEE Trans Intell Transp Syst 2022; 23: 23559–72. [CrossRef] [Google Scholar]
- Zhang K, Su R and Zhang H et al. Adaptive resilient event-triggered control design of autonomous vehicles with an iterative single critic learning framework. IEEE Trans Neural Networks Learn Syst 2021; 32: 5502–11. [CrossRef] [PubMed] [Google Scholar]
- Wang Y, Bian N and Zhang L et al. Resilient pathfollowing control of autonomous vehicles subject to intermittent denial-of-service attacks. IET Intell Transp Syst 2021; 15: 1508–21. [CrossRef] [Google Scholar]
- Boddupalli S, Rao AS and Ray S. Resilient cooperative adaptive cruise control for autonomous vehicles using machine learning. IEEE Trans Intell Transp Syst 2022; 23: 15655–72. [CrossRef] [Google Scholar]
- Dongfeng Motor. 2 Gold, 1 Silver, and 2 Challenge Awards. Fully demonstrated Dongfeng Fengshen L3-ADAS. http://www.whkfq.gov.cn/xwzx/yw/kfqyw/qnxw/202206/t202206281995169.html. [Google Scholar]
- Hoehn A and Zhang P. Detection of covert attacks and zero dynamics attacks in cyber-physical systems. In: 2016 American Control Conference (ACC), 2016, 302–7. [Google Scholar]
- Alieyan K, Kadhum M and Anbar M et al. An overview of DDoS attacks based on DNS. In: 2016 International Conference on Information and Communication Technology Convergence (ICTC), 2016, 276–80. [CrossRef] [Google Scholar]
- Peters SC and Iagnemma K. Stability measurement of high-speed vehicles. Veh Syst Dyn 2009; 47(6): 701–20. [CrossRef] [Google Scholar]
- Jiang Y, Wu S and Yang H et al. Secure data transmission and trustworthiness judgment approaches against cyberphysical attacks in an integrated data-driven framework. IEEE Trans Syst Man Cybern: Syst 2022; 52(12): 7799–809. [CrossRef] [Google Scholar]
- Ward D, Ibarra A ann Ruddle A. Threat analysis and risk assessment in automotive cyber security. SAE Int J Passeng Cars – Electron Electr Syst 2013; 6(2): 507–13. [CrossRef] [Google Scholar]
- Othmane LB, Fernando R and Ranchal R et al. Likelihood of threats to connected vehicles. Int J Next-Gener Comput 2014; 5(3): 290–303. [Google Scholar]
- Petit J and Shladover E. Potential cyberattacks on automated vehicles. IEEE Trans Intell Transp Syst 2015; 16(2): 546–56. [Google Scholar]
- Bayer S, Enderle T and Oka DK et al. Security crash test – practical security evaluations of automotive onboard IT components. Automot Saf Secur 2015; 240: 125–39. [Google Scholar]
- Georg M, Eric A and Eugen B et al. Threat and risk assessment methodologies in the automotive domain. Procedia Comput Sci 2016; 83: 1288|94. [Google Scholar]
- Islam MM, Lautenbach A and Sandberg C et al. A risk assessment framework for automotive embedded systems. In: Proceedings of the 2nd ACM International Workshop on Cyber-Physical System Security, 2016, 3–14. [CrossRef] [Google Scholar]
- Alcaraz C, Lopez J and Wolthusen S. OCPP protocol: security threats and challenges. IEEE Trans Smart Grid 2017; 8(5): 2452–59. [CrossRef] [Google Scholar]
- Cheah M, Shaikh SA and Bryans J et al. Building an automotive security assurance case using systematic security evaluations. Comput Secur 2018; 77: 360–79. [CrossRef] [Google Scholar]
- Morris D, Madzudzo G and Garcia-Perez A. Cybersecurity and the auto industry: the growing challenges presented by connected cars. Int J Automot Technol Manage 2018; 18(2): 105–18. [CrossRef] [Google Scholar]
- Bolovinou A, Atmaca UI and Sheik AT et al. TARA+: controllability-aware threat analysis and risk assessment for L3 automated driving systems. In: IEEE Intelligent Vehicles Symposium (IV), 2019, 8–13. [Google Scholar]
- Khan SK, Shiwakoti N and Stasinopoulos P. A conceptual system dynamics model for cybersecurity assessment of connected and autonomous vehicles. Accid Anal Prev 2022; 165: 106515. [CrossRef] [PubMed] [Google Scholar]
- Moukahal L, Zulkernine M and Soukup M. AVSDA: Autonomous vehicle security decay assessment. In: Risks and Security of Internet and Systems: 16th International Conference, 2022, 20–37. [Google Scholar]
- Ying X, Sagong SU and Clark A et al. Shape of the cloak: formal analysis of clock skew-based intrusion detection system in controller area networks. IEEE Trans Inf Forensics Secur 2019; 14(9): 2300–14. [CrossRef] [Google Scholar]
- VanWyk F, Wang Y and Khojandi A et al. Real-time sensor anomaly detection and identification in automated vehicles. IEEE Trans Intell Transp Syst 2019; 21(3): 1264–76. [Google Scholar]
- Olufowobi H, Young C and Zambreno J et al. SAIDuCANT: specification-based automotive intrusion detection using controller area network (CAN) timing. IEEE Trans Veh Technol 2020; 69(2): 1484–94. [CrossRef] [Google Scholar]
- Xie G, Yang LT and Liu Y et al. Security enhancement for real-time independent in-vehicle CAN-FD messages in vehicular networks. IEEE Trans Veh Technol 2021; 70(6): 5244–53. [CrossRef] [Google Scholar]
- Liu J and Park J. Seeing is not always believing: detecting perception error attacks against autonomous vehicles. IEEE Trans Dependable Secure Comput 2021; 18(5): 2209–23. [Google Scholar]

Yulei Wang received a Ph.D. degree in control science and engineering from the Harbin Institute of Technology in 2013. From 2013 to 2020, he worked as an associate professor with the College of Communication Engineering, at Jilin University, China. He is currently an research fellow with the Department of Control Science and Engineering, at Tongji University. His main research interests include autonomous driving, artificial intelligence, vehicle control engineering, and intelligent transportation systems.

An Huang received a B.E. degree in electrical engineering and automation from Nanjing University of Aeronautics and Astronautics, Nanjing, China in 2021. He is currently working towards an M.S. degree in Control Science and Engineering at the School of Electronics and Information Engineering, Tongji University, Shanghai, China. His research interests include networked control systems, cyber security of cyber-physical systems, autonomous vehicles, and vehicle dynamics and control.

Fan Yang received a B.E. degree in Mechanical design, manufacturing, and automation and the M.E. degree in Solid Mechanics from Tianjin University Tianjin, China, in 2014 and 2017. He is currently an ADAS algorithm engineer at the technical center of Dongfeng Motor Group, and his main research direction is planning and vehicle control.
Jiazhi Zhang received a B.S. degree in electrical engineering and automation from Shandong University, in 2016. His current research interests include autonomous driving, simulation testing, diagnostic, and automotive communications.

Ning Bian received a M.S. degree in electrical and information technology from the Technical University of Munich, Germany, in 2005, and the Ph.D. degree in automotive control and intelligent driving from the University of Duisburg-Essen, Germany, in 2009. He has worked for more than 15 years for Automated driving and integrated chassis control by BMW Group and Continental AG in Munich and Frankfurt am Main, Germany, and by DongFeng Motor Group in Wuhan, China. He is currently the Senior Chief Engineer at DongFeng Motor Group Technical Center, Wuhan, China, with an interest in intelligent driving, Automated Driving, and Control.

Lulu Guo received a B.S. degree in vehicle engineering and a Ph.D. degree in control engineering from Jilin University, Changchun, China, in 2014 and 2019, respectively. He is currently a Research Professor at Tongji University, Shanghai, China. Before joining Tongji University, he was a Postdoctoral Research Associate with the University of Georgia, Athens, GA, USA. His current research interests include advanced vehicle control, energy management, and vehicle cybersecurity.
All Tables
Research on risk assessment and resilient control for autonomous vehicles (2013–2022)
All Figures
|
Figure 1. System diagram of the Dongfeng Motor Hardware-in-the-Loop simulation platform for AVs |
| In the text | |
|
Figure 2. Diagram of inputs, cyber-attacks, and evaluation metrics |
| In the text | |
|
Figure 3. Index-based phase portrait |
| In the text | |
|
Figure 4. Dongfeng HiL real-time simulation testbed |
| In the text | |
|
Figure 5. Lateral acceleration when different signals are under attack |
| In the text | |
|
Figure 6. Lateral offset when different signals are under attack |
| In the text | |
|
Figure 7. Yaw rate when different signals are under attack |
| In the text | |
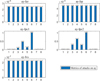 |
Figure 8. Statistical graph of attacks on ay in Table 2 |
| In the text | |
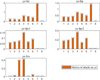 |
Figure 9. Statistical graph of attacks on ye in Table 2 |
| In the text | |
|
Figure 10. Statistical graph of attacks on Ωz in Table 2 |
| In the text | |
|
Figure 11. Statistical graph of attacks on different signals |
| In the text | |
|
Figure 12. Recovery time of different attacks |
| In the text | |
Current usage metrics show cumulative count of Article Views (full-text article views including HTML views, PDF and ePub downloads, according to the available data) and Abstracts Views on Vision4Press platform.
Data correspond to usage on the plateform after 2015. The current usage metrics is available 48-96 hours after online publication and is updated daily on week days.
Initial download of the metrics may take a while.