Open Access
Figure 11.
Download original image
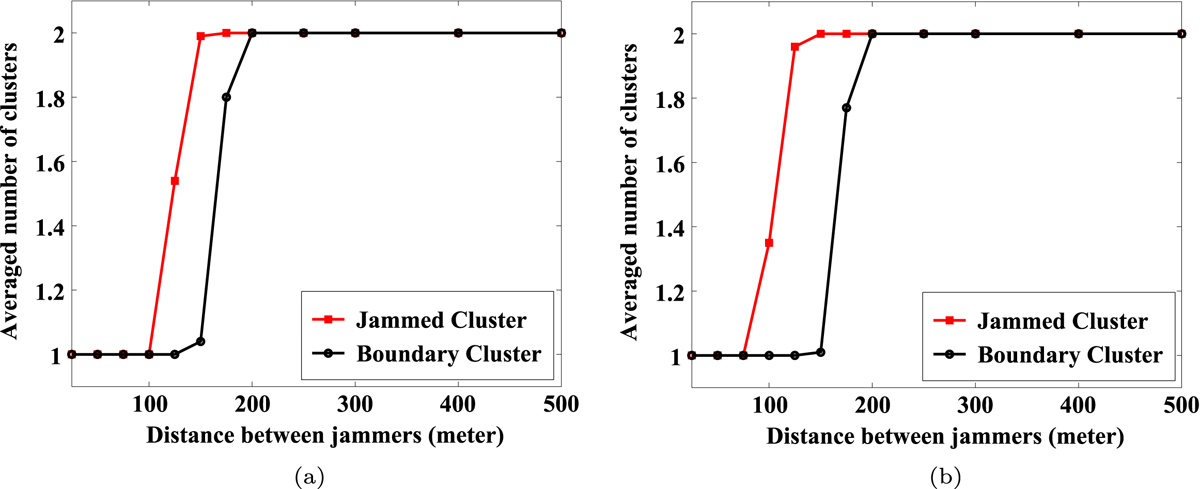
Node topology partitioning study: average number of clusters as a function of the distance between two jammers (2000-node and 3000-node deployment with node transmission range set to 30 m). (a) 2000-node. (b) 3000-node
Current usage metrics show cumulative count of Article Views (full-text article views including HTML views, PDF and ePub downloads, according to the available data) and Abstracts Views on Vision4Press platform.
Data correspond to usage on the plateform after 2015. The current usage metrics is available 48-96 hours after online publication and is updated daily on week days.
Initial download of the metrics may take a while.